
")
OpenTelemetry: The Foundation of Modern Observability
Database for smart decisions

Imagine this: It's 3am, your critical system is reporting errors, and your developers are frantically searching through dozens of log files to find the cause. A customer request runs through 20 different microservices - but where exactly is the problem?
Why OpenTelemetry Is a Game Changer for Observability
According to the Observability Pulse Report 2024, 82% of all companies have a Mean Time to Resolution (MTTR) of over one hour, despite investing heavily in monitoring. One solution lies in OpenTelemetry - the open standard that finally brings order to the chaos of distributed systems. Combined with the ability to capture your own business metrics, OpenTelemetry transforms your IT monitoring from a reactive patchwork quilt into a proactive business intelligence tool.
OpenTelemetry is more than just another monitoring tool - it is the de-facto industry standard for observability. As the second most active Cloud Native Computing Foundation (CNCF) project after Kubernetes, OpenTelemetry solves the fundamental problem of modern distributed systems: the fragmentation of monitoring..
The approach: One standard, all possibilities
Instead of implementing a separate instrumentation for each monitoring solution, OpenTelemetry offers:
- Unified APIs and SDKs for all common programming languages
- Vendor-neutral data formats (OTLP - OpenTelemetry Protocol)
- Automatic instrumentation for popular frameworks and libraries
- Flexible metrics for technical and business KPIs
According to the Grafana Observability Survey, over 42% of companies are already using OpenTelemetry in production, with a further 43% planning to implement it.
The three pillars of complete transparency
Traces (Distributed Tracing): Trace every request through your entire infrastructure.
OpenTelemetry visualizes the complete request flow across all microservices and makes parent-child relationships between service calls transparent. You can not only see exactly where delays occur, but also how errors propagate through your system. Critical paths and performance bottlenecks become immediately visible - an invaluable advantage when optimizing distributed systems.
Metrics: The underestimated goldmine - from system metrics to business intelligence.
OpenTelemetry automatically captures system metrics such as CPU, memory and network traffic, as well as application metrics such as request rates and response times per endpoint. However, the real value lies in custom business metrics: Revenue, conversion rates and feature adoption are aggregated in real time and displayed as histograms. Multi-dimensional analyses allow you to filter and group metrics according to any tags - the basis for data-driven decisions.
Structured logs: Contextualized error analysis with automatic trace correlation.
Thanks to automatic trace context injection, each log entry contains the corresponding trace ID, allowing all logs of a request to be correlated across services. Instead of unstructured text files, you work with JSON-based logs and standardized semantic conventions. The result: efficient searches for any attributes without complex RegEx expressions and faster error analysis.
OpenTelemetry Custom Metrics: Technology Meets Business
While standard metrics like CPU utilization and response times are important, the true business value lies in custom metrics. These customized metrics bridge the gap between technical performance and business success.
From technical to business insights
- Revenue per minute broken down by payment method
- Cart size in correlation to page load time
- Conversion rate dependent on the API latency
- Customer satisfaction based on error rates of certain features
With OpenTelemetry, this becomes a reality. The platform makes it possible to define any business metrics and correlate them with technical data. This creates a holistic picture of your digital processes.
Real-World Impact: Custom Metrics in action
Process optimization through detailed metrics
Histograms and counters can be used to precisely monitor critical business processes. For example, you can measure both the duration and the abandonment rate for each step of a checkout process. Such metrics make it possible to optimize processes in a data-driven manner: They identify weak points, uncover performance problems and show optimization potential. The combination of duration measurements and abandonment tracking provides a complete picture of the user experience.
Making value creation transparent
Custom Metrics can directly measure the business value of features and functions. By recording the frequency of use in combination with the business value generated per feature, an objective basis for decision-making is created for product development. The multi-dimensional recording - for example by customer segment, industry or tariff model - creates insights that go far beyond simple usage statistics. This type of metrics forms the basis for well-founded product decisions, usage-based business models and proactive customer management.
OpenTelemetry Tools in Practical Use
Azure Application Insights: Business Metrics meets AI
Azure Application Insights shines particularly when it comes to analyzing custom metrics thanks to its AI-supported anomaly detection, which automatically identifies unusual patterns in your business metrics. The platform automatically correlates technical and business KPIs - for example, if the response time increases and the conversion rate decreases at the same time, Application Insights makes these correlations visible. Particularly valuable for decision-makers is the seamless Power BI integration, which makes it possible to integrate technical observability data directly into executive dashboards.
Grafana: Flexible visualization for all stakeholders
With the open source project Grafana, you can create customized dashboards for every need: DevOps teams get detailed technical views, product owners see business-relevant metrics in context, and the C-level gets aggregated executive views with the most important KPIs. This flexibility makes Grafana the tool of choice for heterogeneous teams.
Jaeger: Deep-dive analysis for performance optimization
Jaeger enables the correlation of business metrics with trace data and thus answers business-critical questions: Which services influence the conversion rate? Where do delays occur that cost sales? Through detailed trace analysis, you can not only identify technical problems, but also link them directly to their business impact. This link between technical performance and business impact makes Jaeger an indispensable tool for data-driven optimization.
Integrate OpenTelemetry in .Net: It’s That Easy
For .NET developers, integration is particularly easy thanks to mature libraries:
")
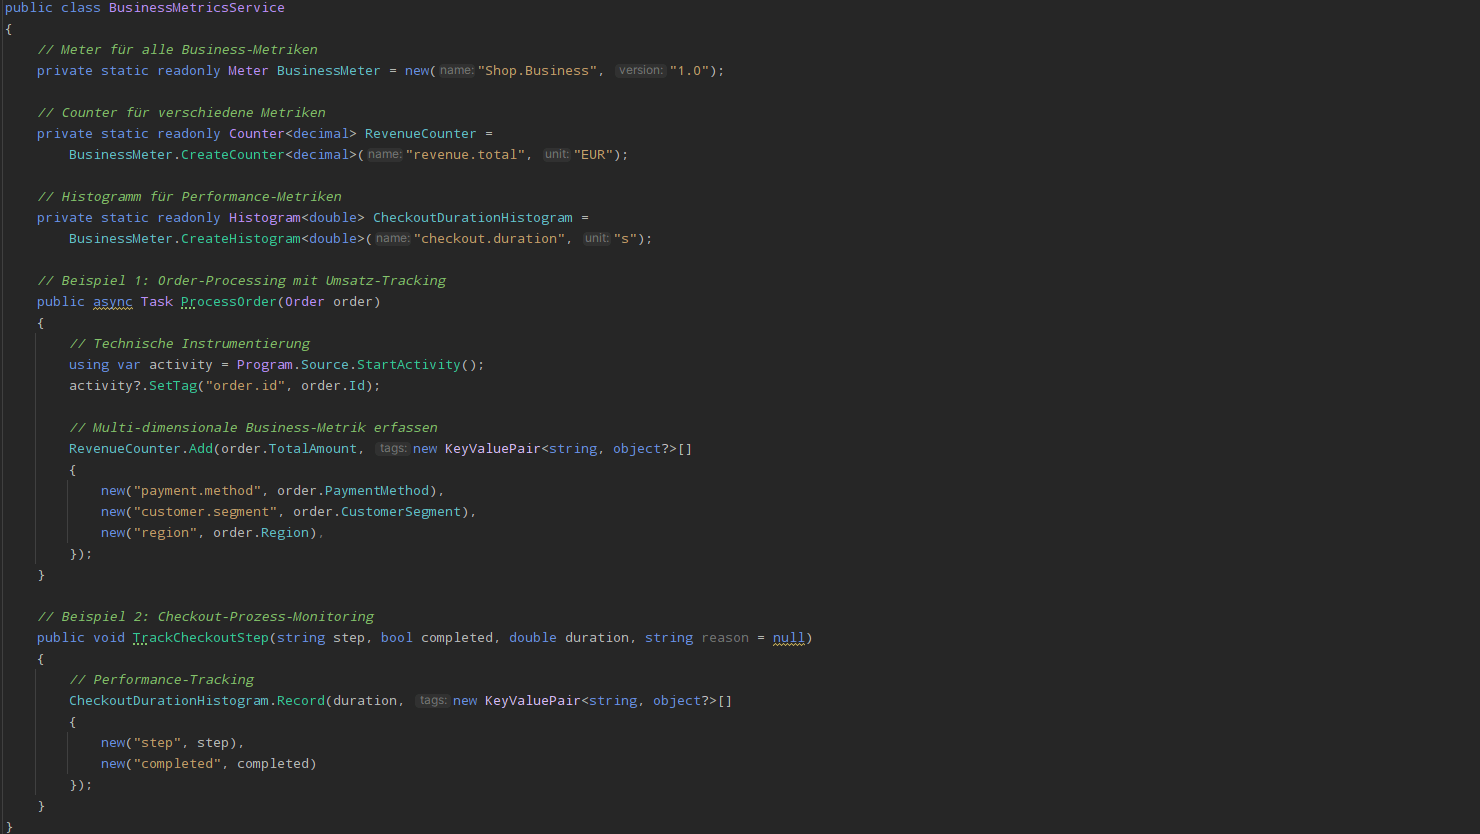
With this integrated approach, you have all important business metrics in one place. The multi-dimensional tags make it possible to analyze the data later from different angles - be it by region, payment method, customer segment or feature usage.
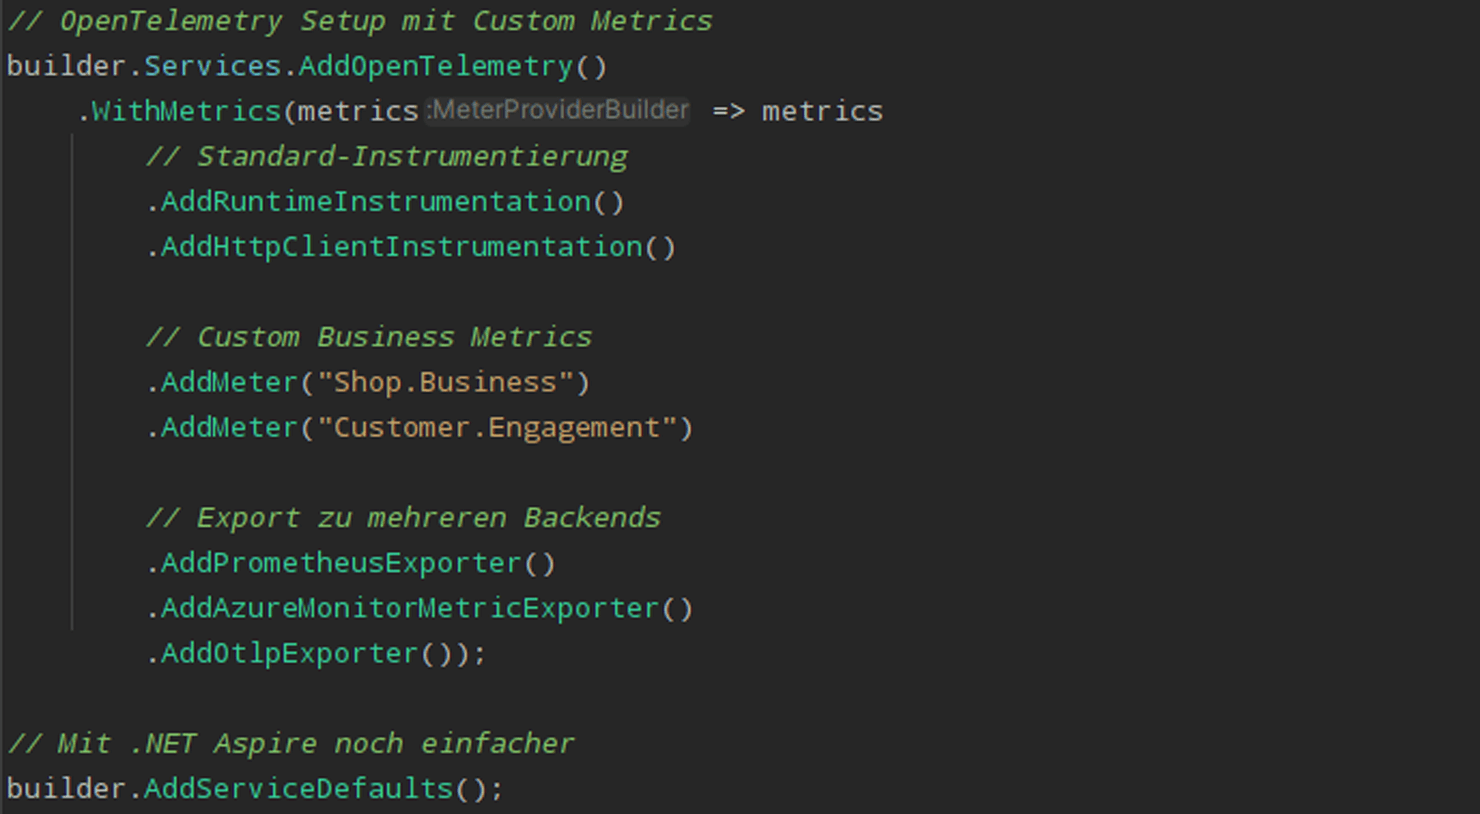
Integration into .NET web applications is then child's play:
")
Best Practices and Patterns with OpenTelemetry
Context propagation for end-to-end visibility
Context propagation is at the heart of distributed tracing. Important context information such as order IDs, customer segments or transaction IDs are automatically passed on by all participating services. This makes it possible to track a request across service boundaries and correlate all associated logs, metrics and traces. The seamless transfer of this information creates complete transparency across the entire request flow.
Intelligent sampling strategies
Not every request needs to be tracked in full - that would incur unnecessary costs. Intelligent sampling strategies make it possible to find the right balance between costs and observability. Typical approaches include:
- Basic sampling: A defined percentage of all requests is recorded (e.g. 10%).
- Error prioritization: Faulty requests are always recorded at 100%
- Performance-based sampling: Slow requests receive higher sampling rates
- Parent-Based Sampling: Follows the sampling decision of the original service
These adaptive strategies ensure that important information is never lost, while the overall costs remain manageable.
Efficient metric patterns
OpenTelemetry offers different metric types for different use cases. Counters are suitable for cumulative values such as orders or errors. Histograms record distributions such as response times or file sizes. Gauges show current statuses such as active connections or memory usage. The trick is to choose the right metric type for each use case and to implement them efficiently.
These patterns show the variety of possibilities with OpenTelemetry. The implementation is straightforward and well documented thanks to the mature .NET libraries.
OpenTelemetry Best Practices for Business Metrics
1. define metrics with business value
For each metric, ask yourself:
- Which business decision supports this metric?
- Which threshold value triggers an action?
- Who is the stakeholder for this information?
2. clever use of dimensions
Multi-dimensional analyses enable deep business insights. Clever tag selection allows you to view your data from different angles: Which marketing campaign has the highest ROI? Do mobile users perform differently to desktop users? Are there regional differences in purchasing behavior? The trick is to find the right balance between depth of detail and clarity.
OpenTelemetry and ROI: What Observability Studies Show
The New Relic Observability Forecast 2024 shows impressive figures:
- Cost-efficient: the average ROI shows 4 euros in savings for every euro invested - a doubling year-over-year
- 48% reduced costs for incidents, in companies that have implemented full-stack observability
- 79% of respondents stated that observability helps to achieve business goals
According to the New Relic State of Observability Report for Retail 2024, companies with a mature observability strategy reduce their annual downtime by an average of 63%..
Data-Driven Decisions with OpenTelemetry
Phase 1: Laying the foundation
- Implement OpenTelemetry integration
- Enable basic metrics
- Set up export to selected platform
Phase 2: Introduce business metrics
- Workshop with stakeholders: Which KPIs are important?
- Implement first custom metrics
- Create dashboards for different target groups
Phase 3: Generate insights
- Analyze data and recognize patterns
- A/B tests with metrics tracking
- Continuous optimization based on data
OpenTelemetry Combines Technology and Business Value
OpenTelemetry is more than a technical tool - it is the bridge between IT and business. Custom metrics transform technical data into business insights and enable:
- Real-time decisions based on current data
- Proactive optimization instead of reactive troubleshooting
- Measurable ROI for every development effort
- Alignment between technical and business goals
Your next step towards data-driven excellence
The combination of OpenTelemetry and sophisticated custom metrics is your key to:
- Transparent business processes
- Founded decisions
- Measurable business success
Start small, think big: Start with a critical business metric, implement it with OpenTelemetry, and experience the power of data-driven decisions.
Do you need support in defining and implementing your business metrics? Our experts combine technical expertise with business understanding. From metrics definition to technical implementation and a meaningful dashboard - we accompany you on the path to true business observability.
Written by
Fabian Berthold has been working as a .NET developer for over 10 years, during which time he has developed a deep understanding of innovative technologies and their application. He has been with Arvato Systems since 2022, where he uses his passion for technology and his expertise to drive innovative solutions.